Group plotting challenge
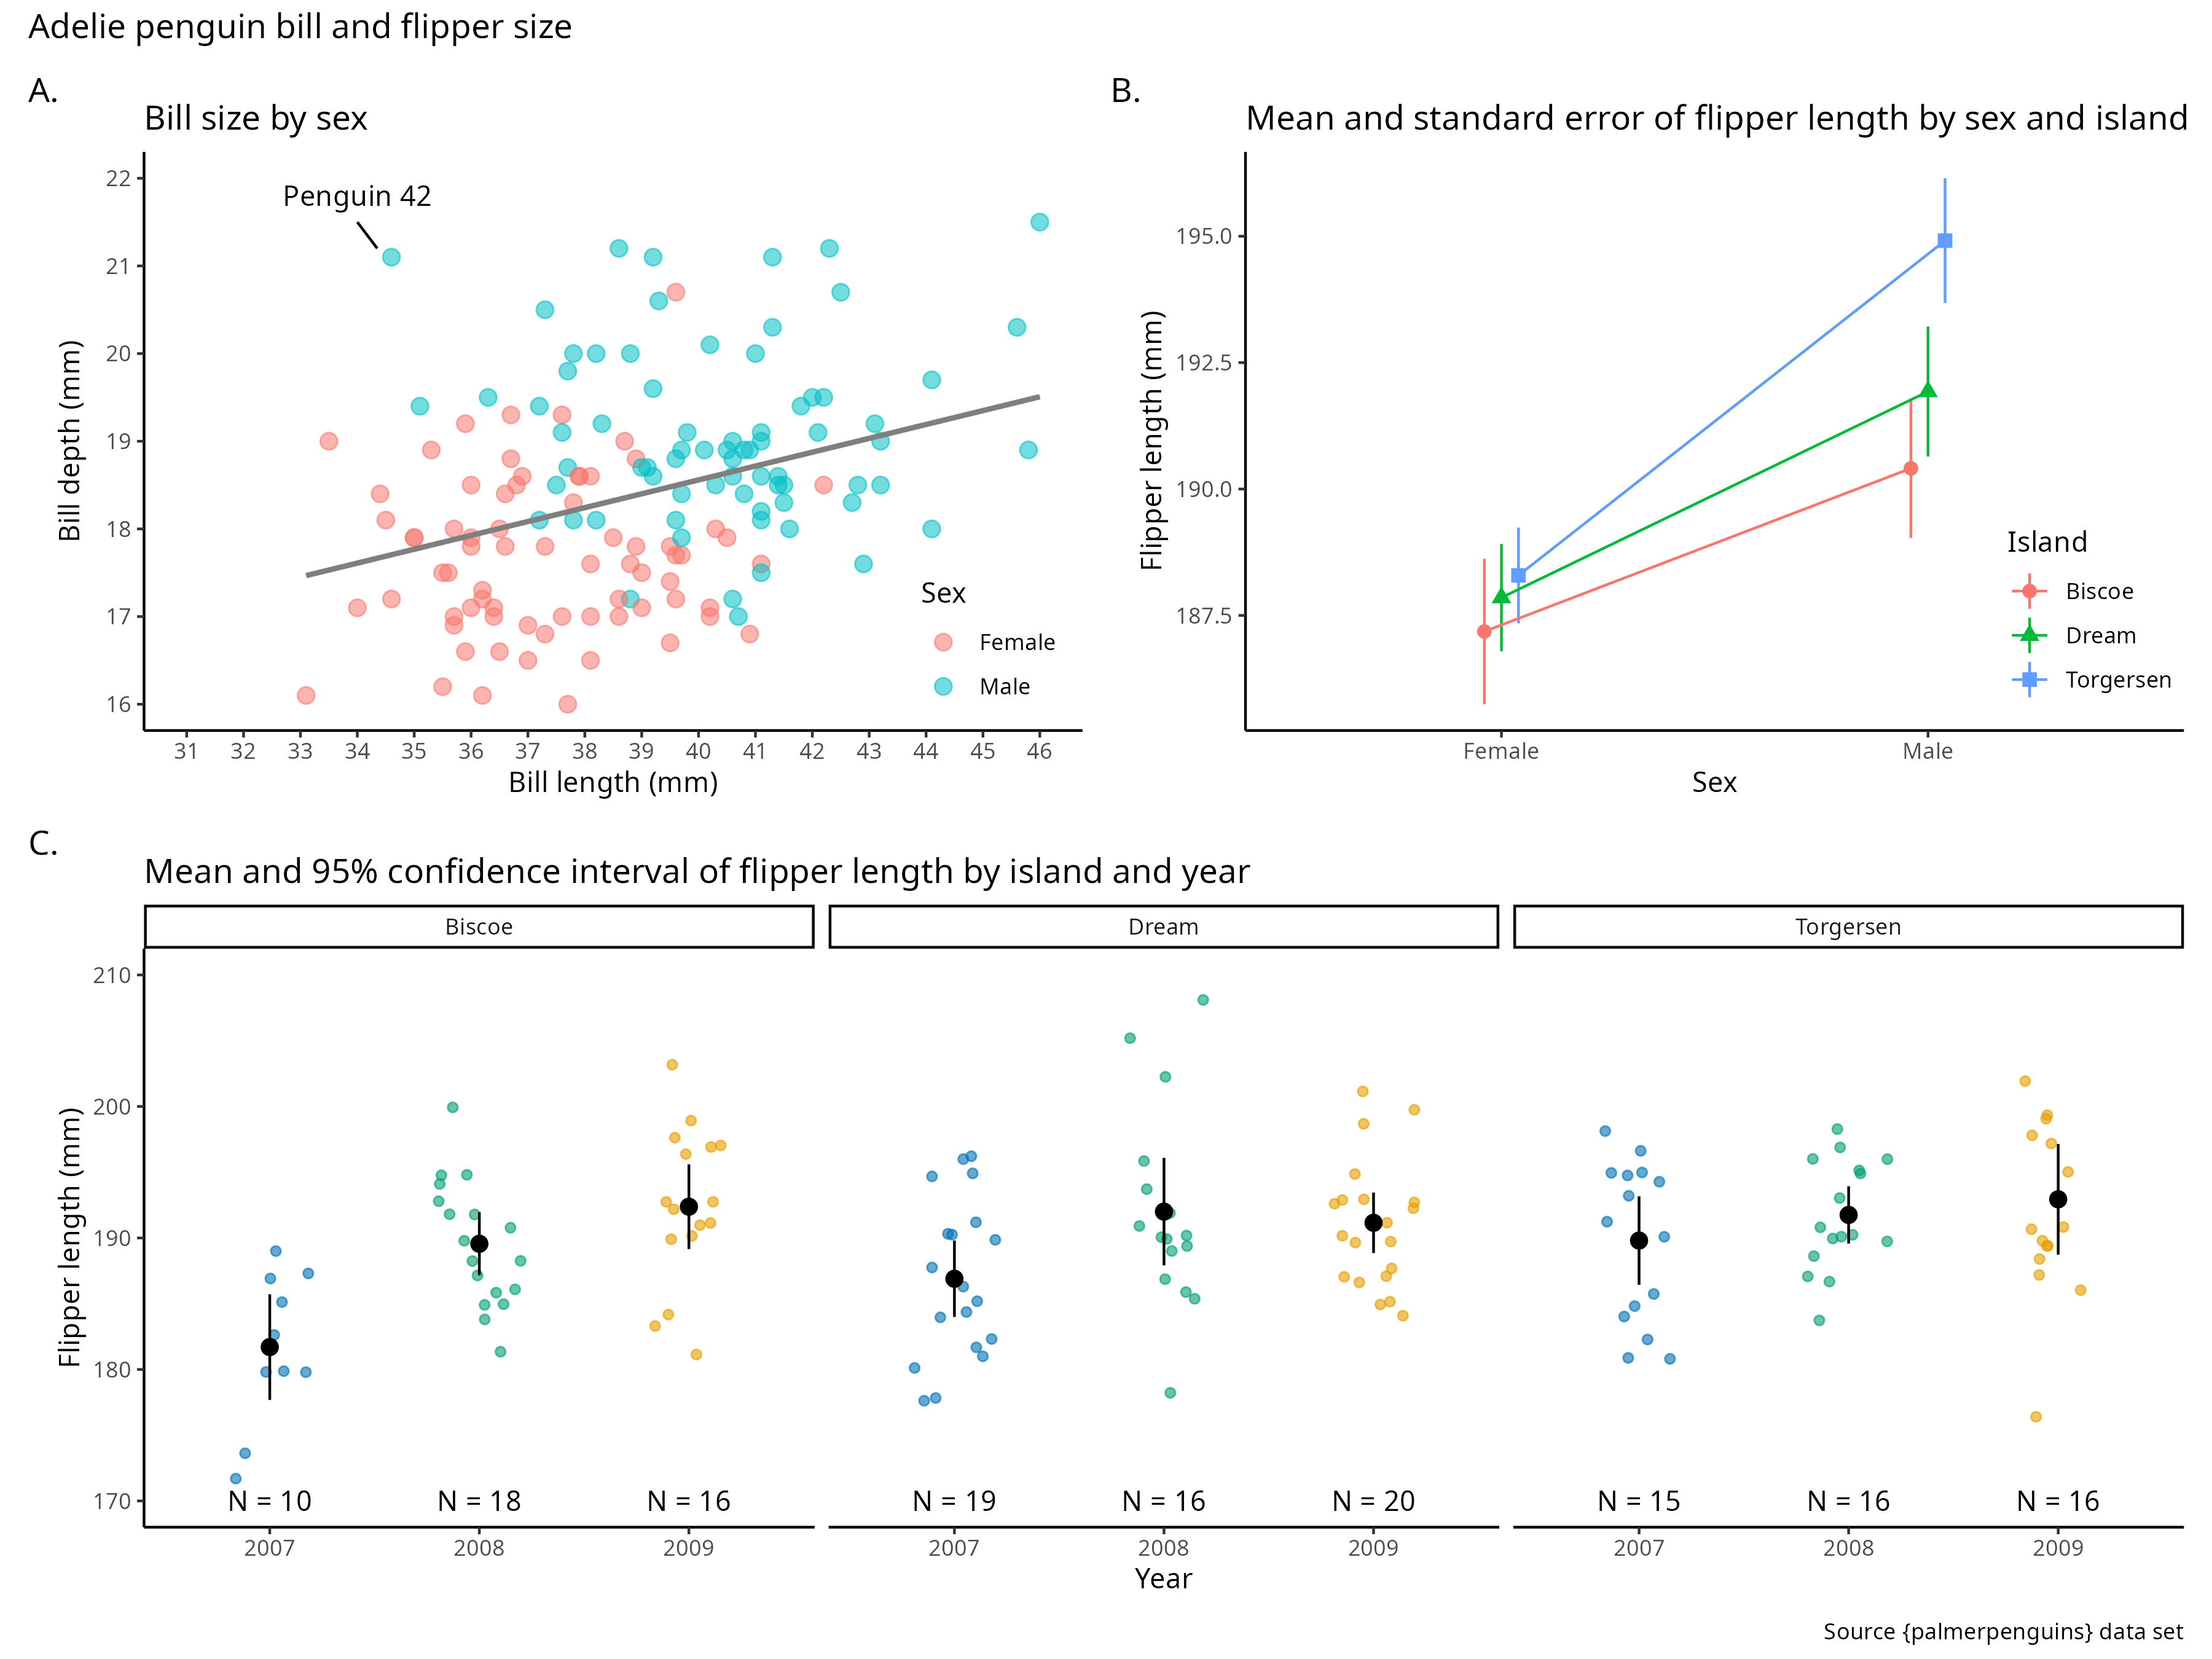
Using the penguins data set from the {palmerpenguins} package, recreate this plot. Don’t worry about exact locations, size, or scaling. But pay attention to subsetting of the data and capitalization of text. Feel free to write the code in an R script or R Markdown document. Upload your code and image file to Canvas under Exercise: Plotting challenge.
Two hints: Use 1234 as a random seed, and use the file dimensions of 8 inches wide by 6 inches high.