60 * 60 * 24 * 365[1] 31536000Let’s go to R’s console, which is the direct connection to the R engine. In the console, you give R a command, and it returns the output.
R can be a very fancy calculator. Let’s do some calculations by entering numerical operations into the console. How many seconds are there in a year?
60 * 60 * 24 * 365[1] 31536000On average, how many days are in each month of a leap year?
366 / 12[1] 30.5R also can store, manipulate, and return text. But working with text requires wrapping the characters in quotation marks (either " or '). Type this out and replace <name> with your name: "My name is <name>!".
"My name is Jeff!"[1] "My name is Jeff!"You can also apply functions to text. If we want to yell our names, let’s convert the string of characters to upper case with the toupper() function. Put the previous text inside the parentheses of toupper().
toupper("My name is Jeff!")[1] "MY NAME IS JEFF!"Press the up arrow ⬆️ to place previous commands in the console. Navigate to the previous command and change the text a bit.
If you haven’t already, install the {palmerpenguins} and {tidyverse} packages. Remember how to do that?
install.packages(c("palmerpenguins", "tidyverse"))Let’s look at the penguins data set. What do we need to do first?
library(palmerpenguins)View the data set by typing penguins into the console.
penguins# A tibble: 344 × 8
species island bill_length_mm bill_depth_mm flipper_length_mm body_mass_g
<fct> <fct> <dbl> <dbl> <int> <int>
1 Adelie Torgersen 39.1 18.7 181 3750
2 Adelie Torgersen 39.5 17.4 186 3800
3 Adelie Torgersen 40.3 18 195 3250
4 Adelie Torgersen NA NA NA NA
5 Adelie Torgersen 36.7 19.3 193 3450
6 Adelie Torgersen 39.3 20.6 190 3650
7 Adelie Torgersen 38.9 17.8 181 3625
8 Adelie Torgersen 39.2 19.6 195 4675
9 Adelie Torgersen 34.1 18.1 193 3475
10 Adelie Torgersen 42 20.2 190 4250
# ℹ 334 more rows
# ℹ 2 more variables: sex <fct>, year <int>Excellent! We now have wrangled the data to where we want it. Let’s say we want to make a scatterplot of the bill length vs. the bill depth for all birds. We need to use the plot() function for this.
plot(bill_length_mm ~ bill_depth_mm, data = penguins)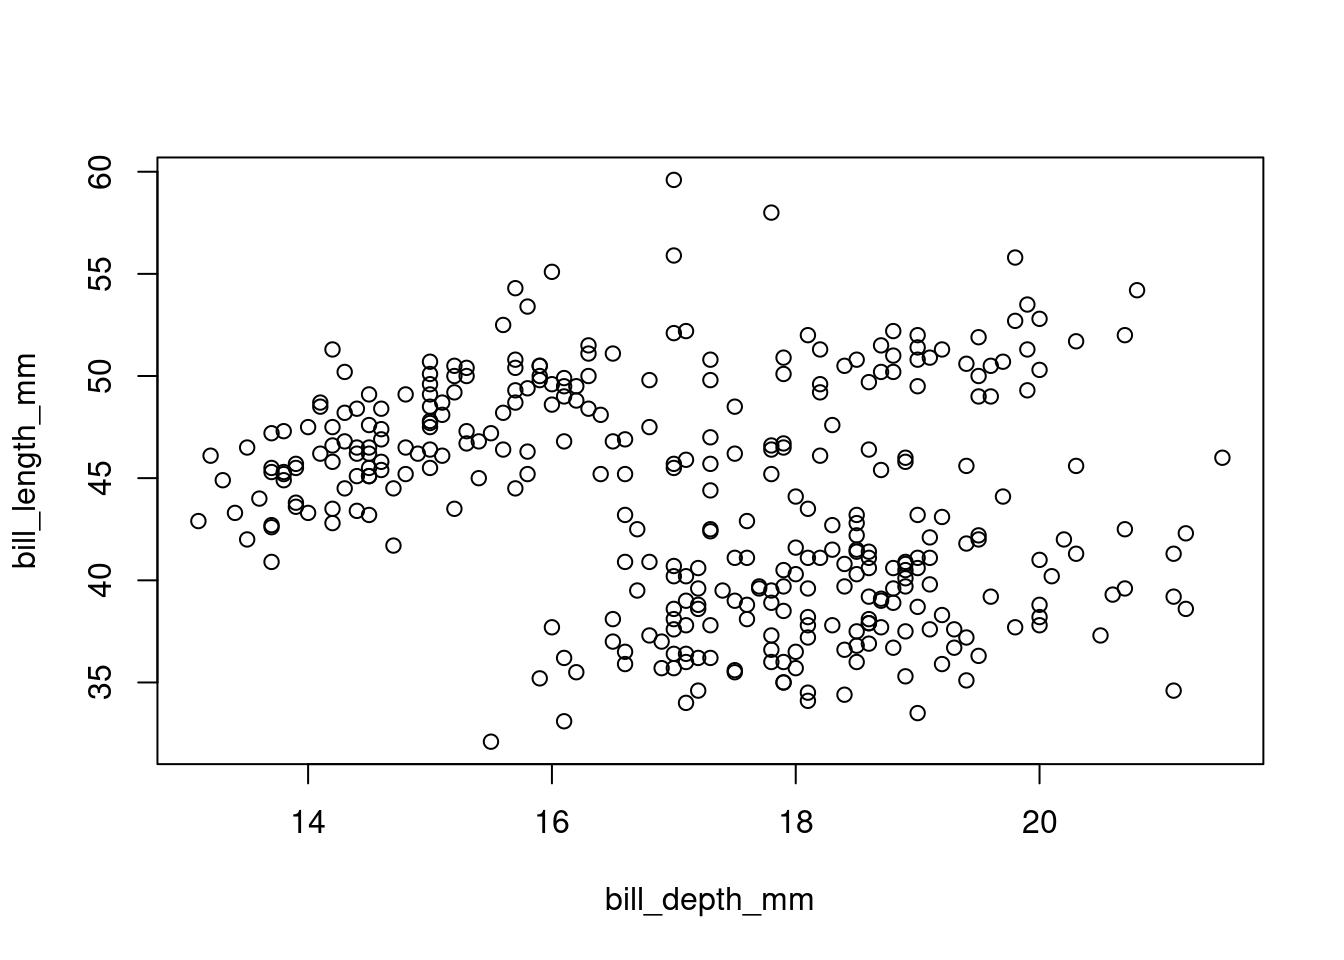
Hey, hey! We have a plot! 📊 Sweet! We’ve input data, wrangled it, and plotted it. Well done! 🎉 💪