install.packages("palmerpenguins")Getting started with R
Data Processing and Visualization in R
2025-01-23
What is R?
R is a statistical programming language.
![]()
What is R?
R is a statistical programming language.
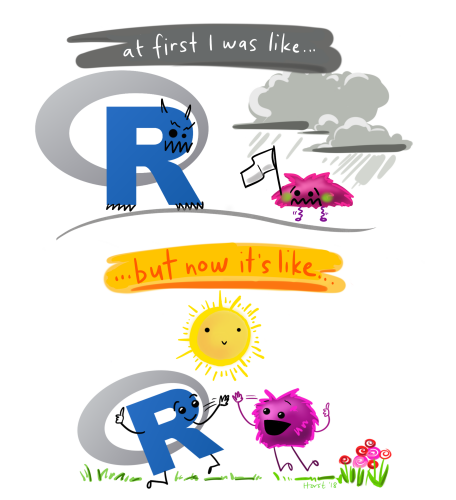
Source: Allison Horst
What is R?
R is a statistical programming language.
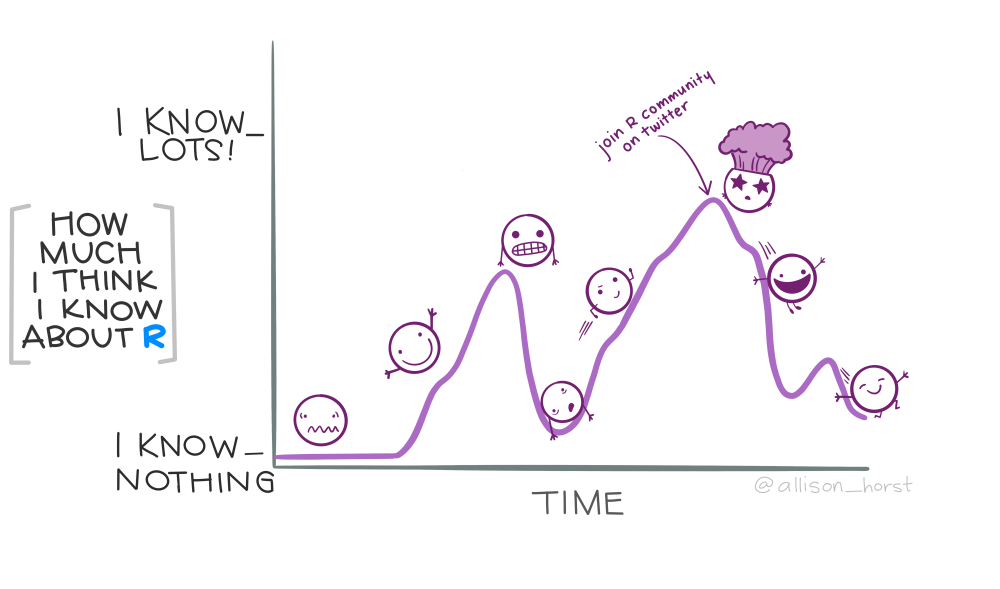
Source: Allison Horst
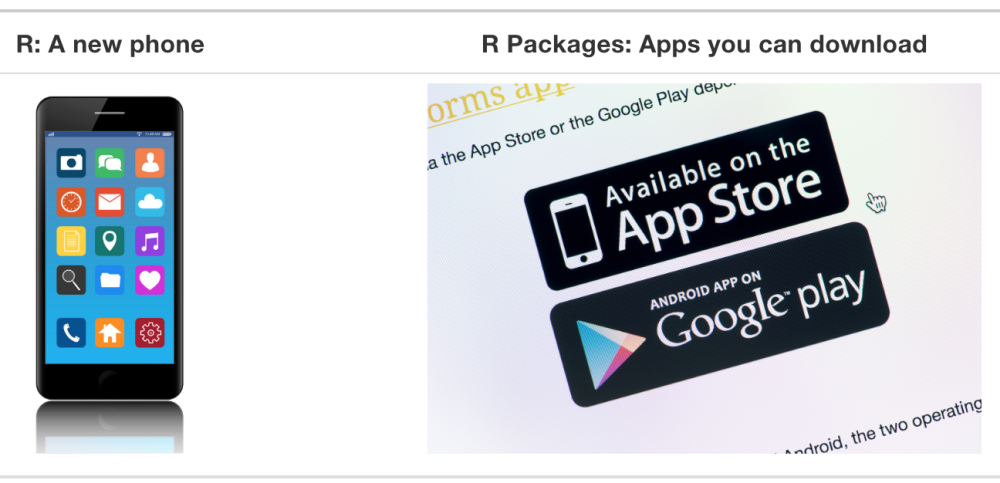
What is R?
R is a statistical programming language.
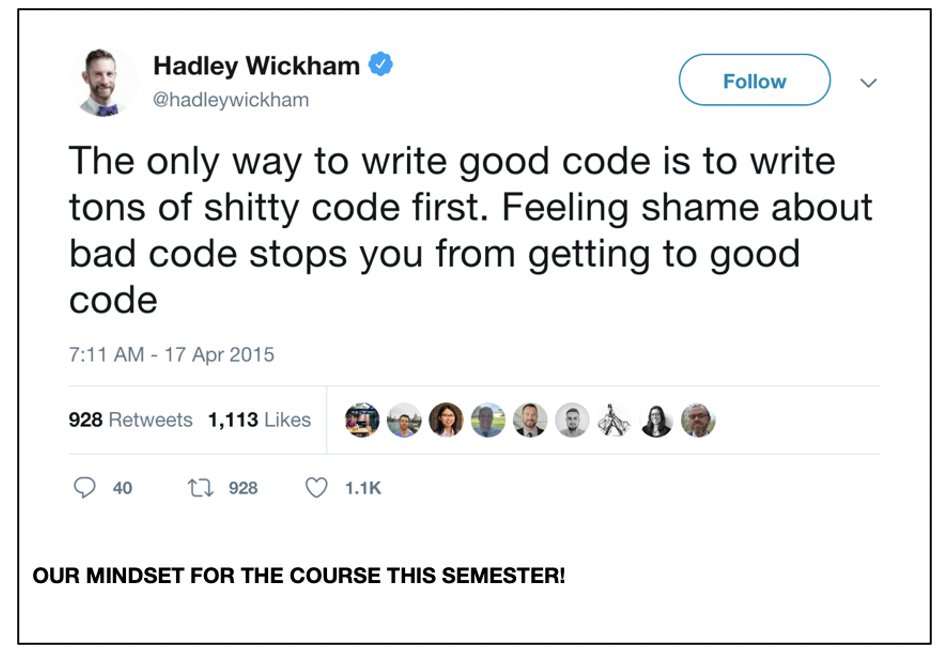
Source: Twitter
Getting started
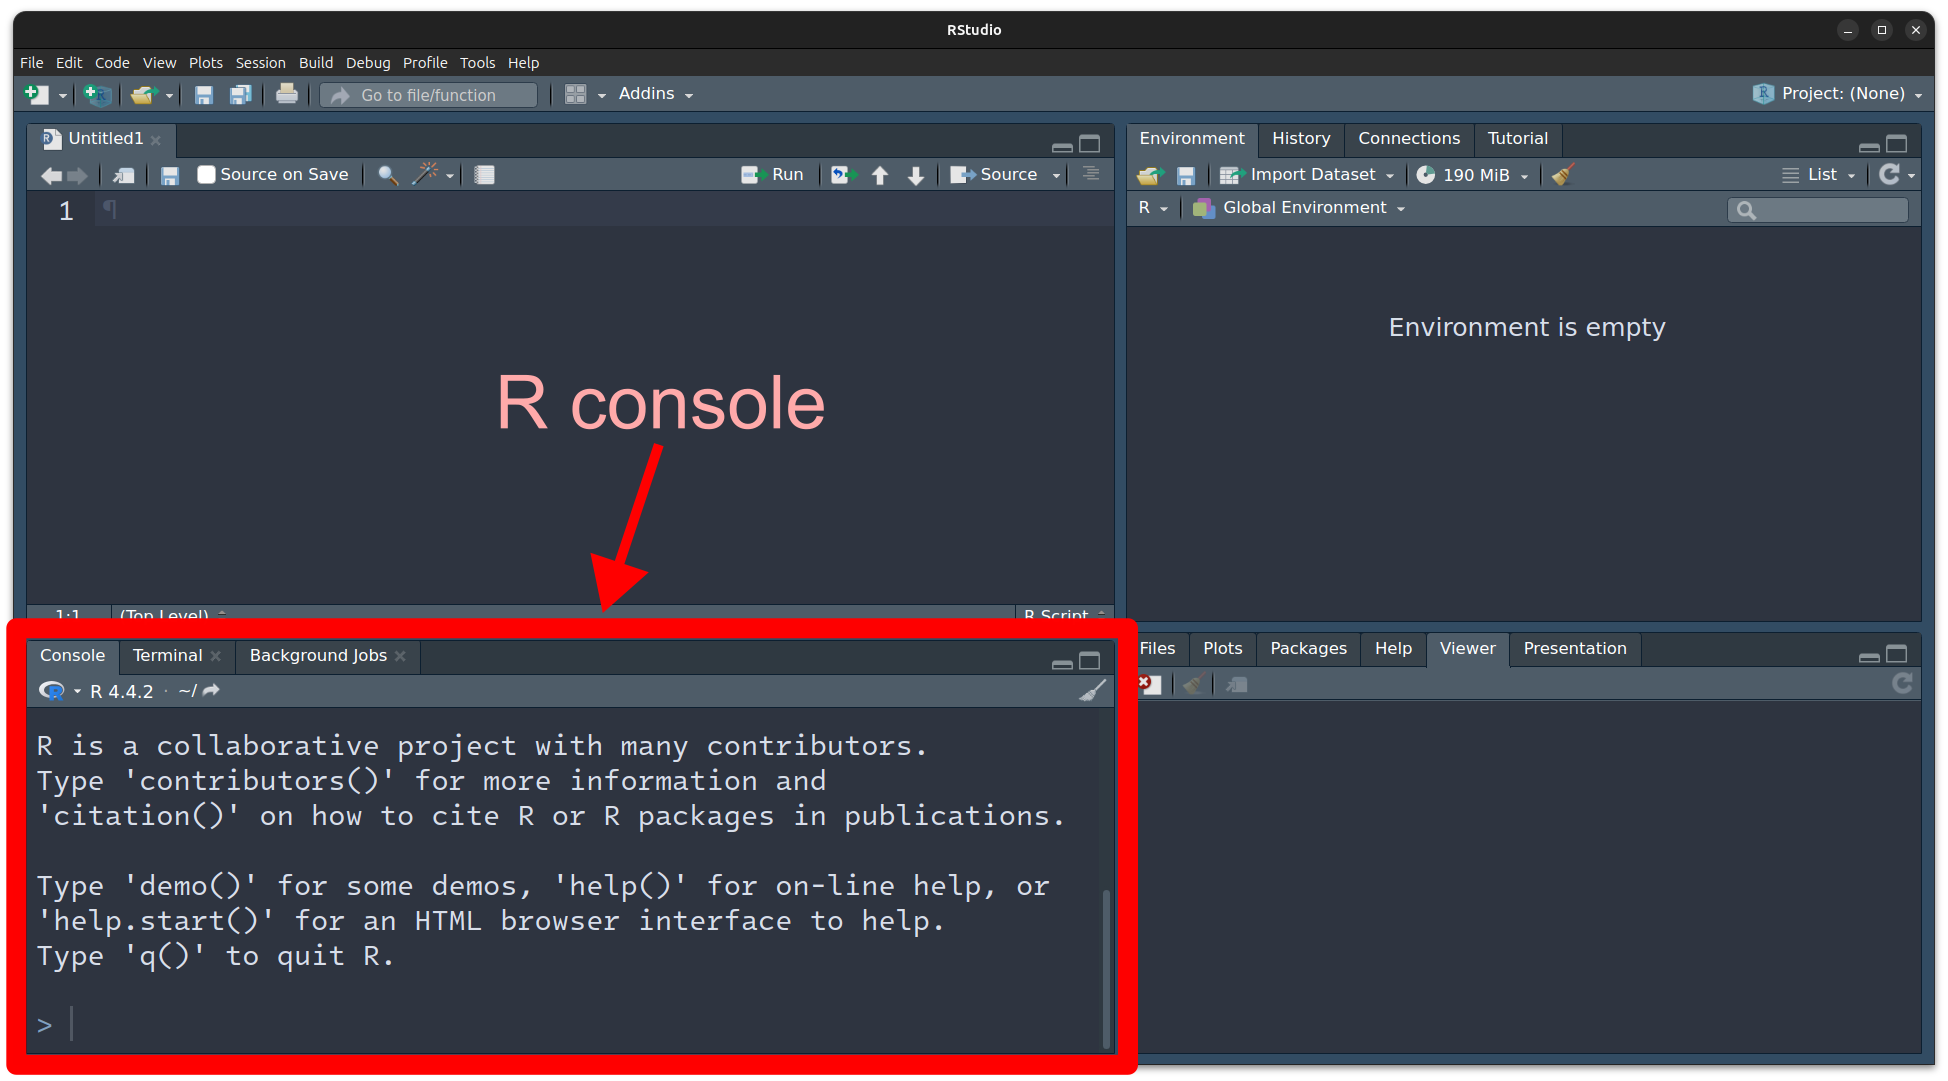
Interacting with R
Using the R console
Packages
Packages are collections of function and data sets
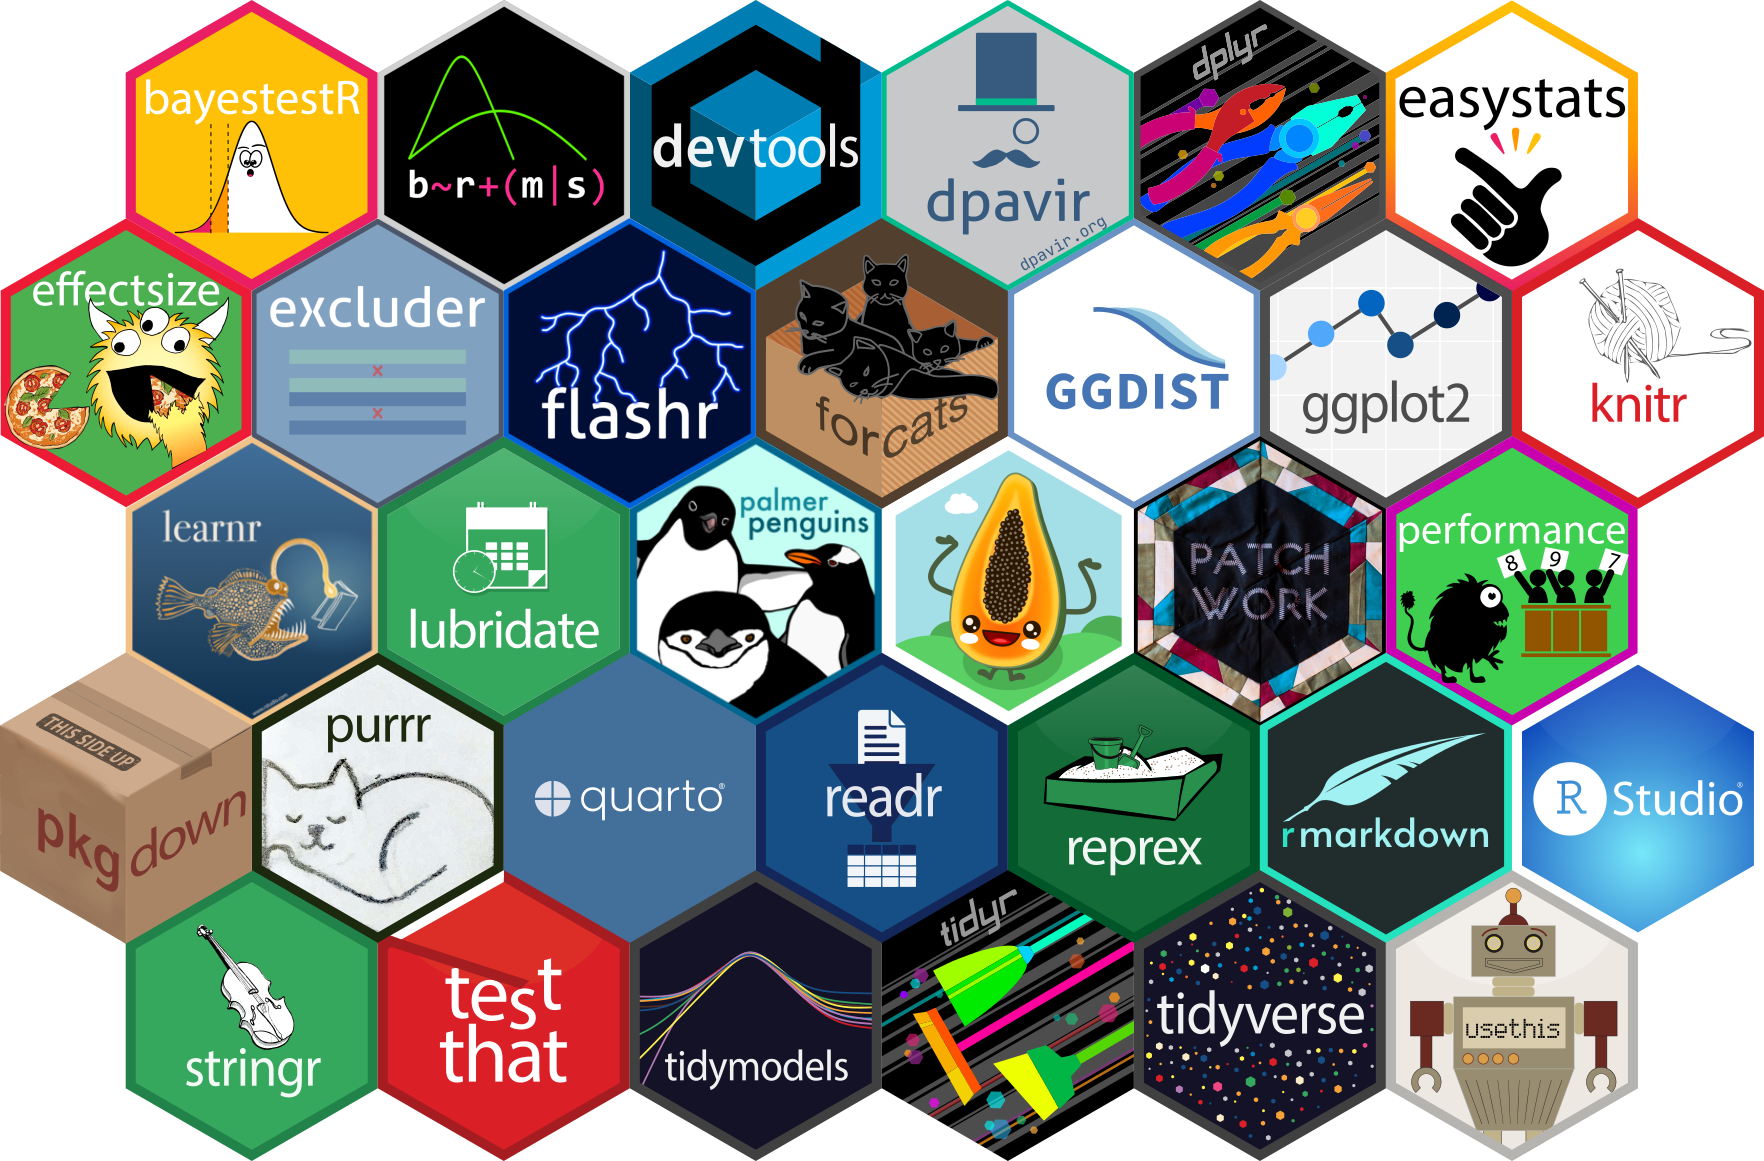
Packages
Base R is a core set of packages for all R installations.
Source: A ModernDive into R and the Tidyverse
Note
User-contributed packages can be found on the Comprehensive R Archive Network or CRAN.
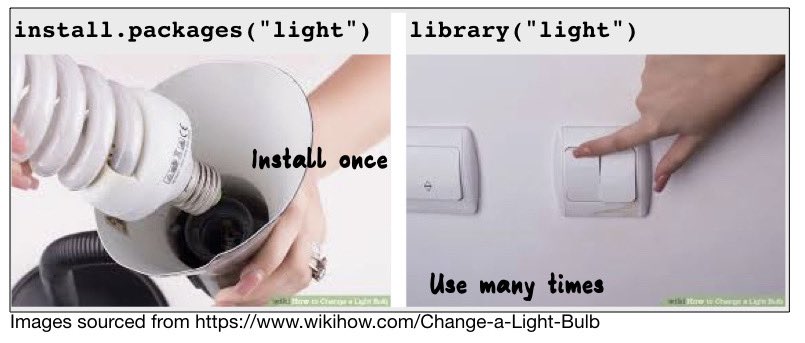
Packages
Loading packages
tidyverse
Homework
Before the first class period
Install R from https://r-project.org
Install RStudio from https://posit.co
Install
{tidyverse}packageComplete course introduction form
Read the syllabus
Read readings in syllabus schedule