Advanced R Markdown
2023-05-08
Set-up
First, load tidyverse and {palmerpenguin} packages
Code chunks
Code chunk options
Go in the {r} header of code chunks (in one line)
-
label = my-chunk- chunk label -
eval = TRUE- evaluates code chunk -
echo = TRUE- displays source code in document -
include = TRUE- displays chunk output in document -
message = TRUE- displays messages in document -
warning = TRUE- displays warnings in document -
error = TRUE- displays errors in document
Code chunk options
Go in the {r} header of code chunks (in one line)
```{r my-chunk, echo = FALSE, message = FALSE, warning = FALSE}
```
Code chunk options
Can also be separated from header using #|
```{r}
#| my-chunk, echo = FALSE, message = FALSE
#| warning = FALSE
```
Global options
Set options globally with knitr::opts_chunk$set()
```{r setup, include = FALSE}
knitr::opts_chunk$set(echo = FALSE, message = FALSE, warning = FALSE)
```
Figures
Figures generated in chunks
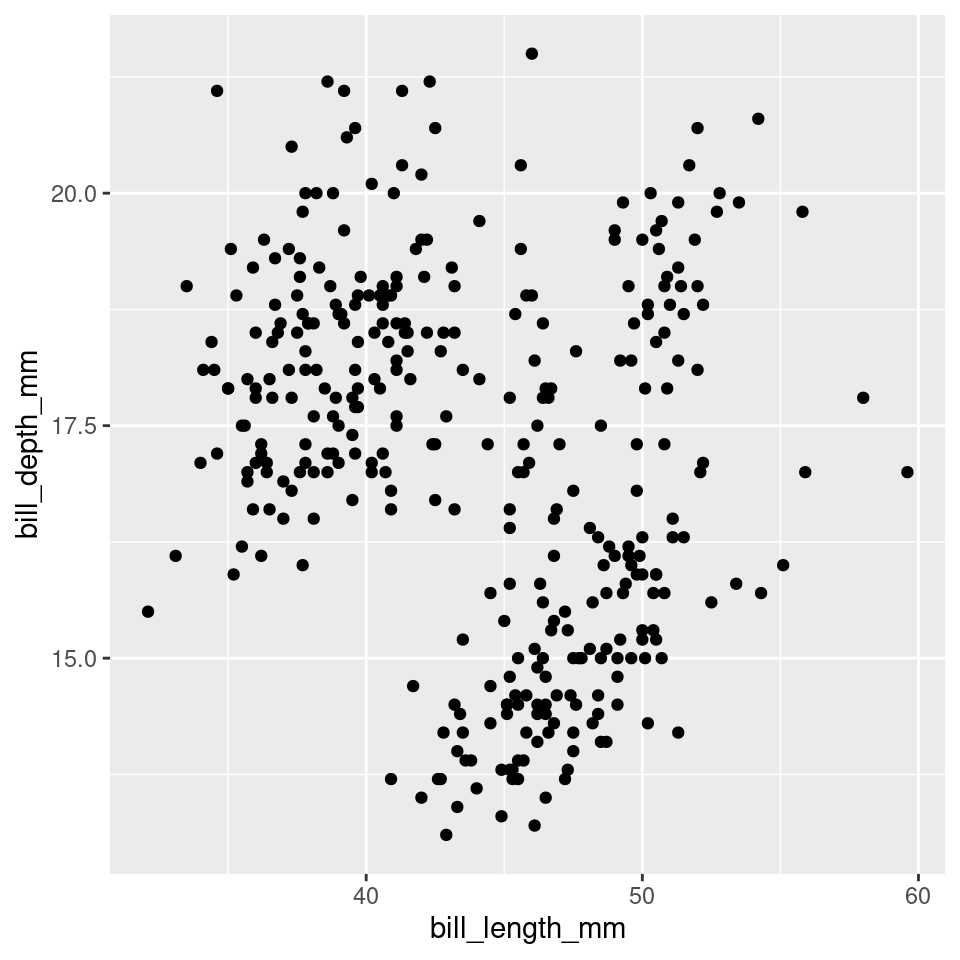
ggplot(penguins, aes(bill_length_mm, bill_depth_mm)) + geom_point()
Figure scaling
fig.width = 5, fig.height = 5
ggplot(penguins, aes(bill_length_mm, bill_depth_mm)) + geom_point()
Figure scaling
fig.width = 3, fig.height = 3
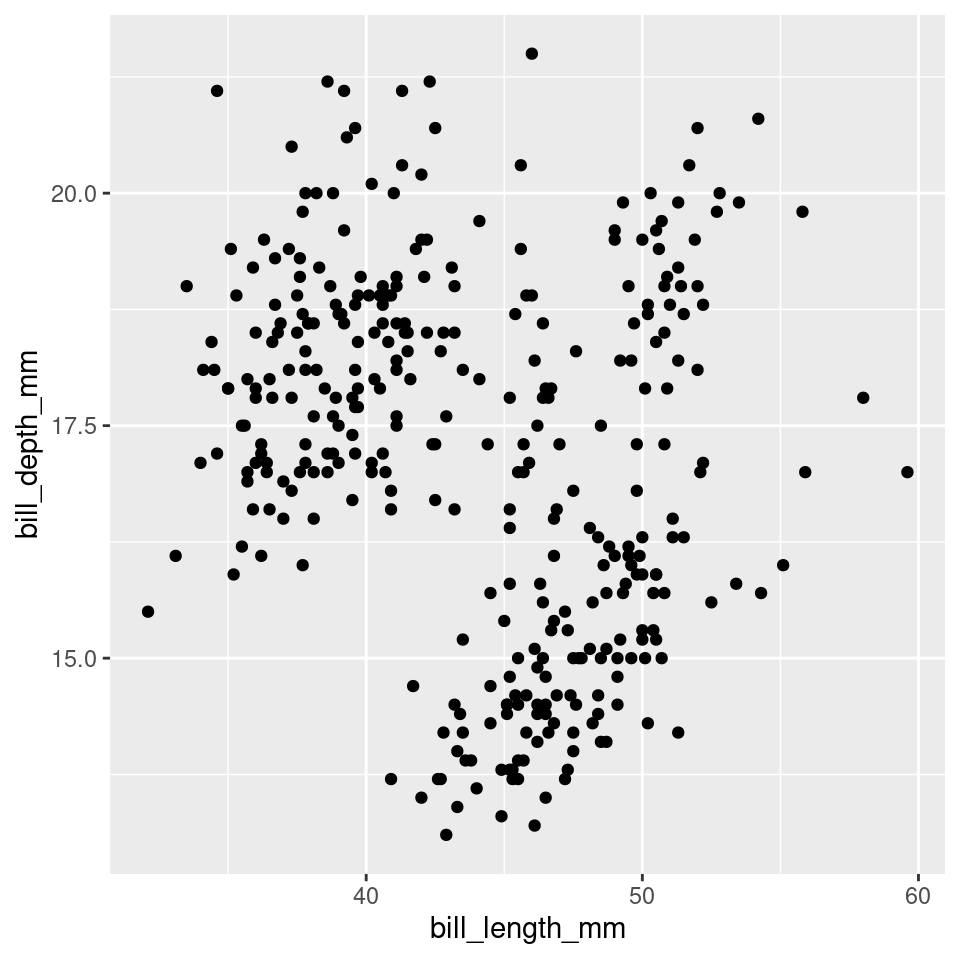
ggplot(penguins, aes(bill_length_mm, bill_depth_mm)) + geom_point()
Output width/height
out.width = "30%", out.height = "30%"
ggplot(penguins, aes(bill_length_mm, bill_depth_mm)) + geom_point()
Figure alignment
fig.align = "center"
ggplot(penguins, aes(bill_length_mm, bill_depth_mm)) + geom_point()
Figure caption
fig.cap = "My figure caption"
ggplot(penguins, aes(bill_length_mm, bill_depth_mm)) + geom_point()
Figure 1: My figure caption
Figure alt text
fig.alt = "Scatterplot of penguin bill length by depth."
ggplot(penguins, aes(bill_length_mm, bill_depth_mm)) + geom_point()
My figure caption
Figure files
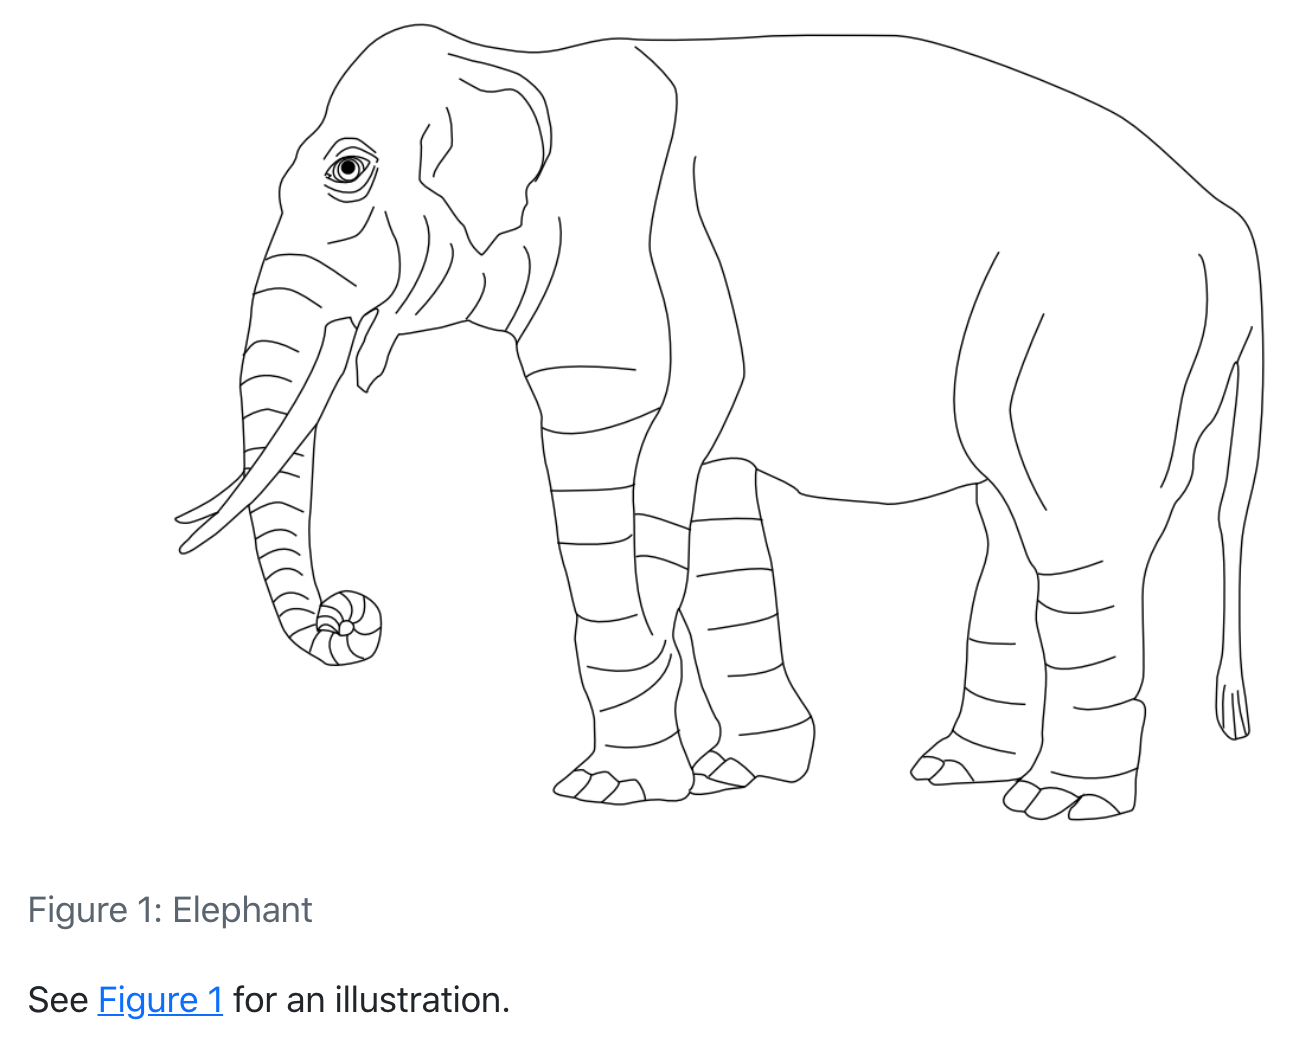
knitr::include_graphics("https://quarto.org/docs/authoring/images/crossref-figure.png")
Cross-referencing
Cross reference figures/tables
Make sure code chunk has a label and a caption
Use a
bookdownoutput format (e.g.,bookdown::pdf_document2,papaja::apa6_pdf,thesisdown)Insert
\ref{fig:chunk-label}for figures and\ref{tab:chunk-label}for tablesNote for Quarto, labels must start with
fig-ortbl-and reference with@fig-labelor@tbl-label(e.g., Figure 1)
Cross reference sections
Label sections with
{#slug}
(e.g.,## Cross reference figures/tables {#sec-cross-reference})Cross reference with
\@ref(slug)For Quarto, cross references must start with
#sec-and are referenced with@sec-label(e.g., Section 4.1)
Citations and bibliographies
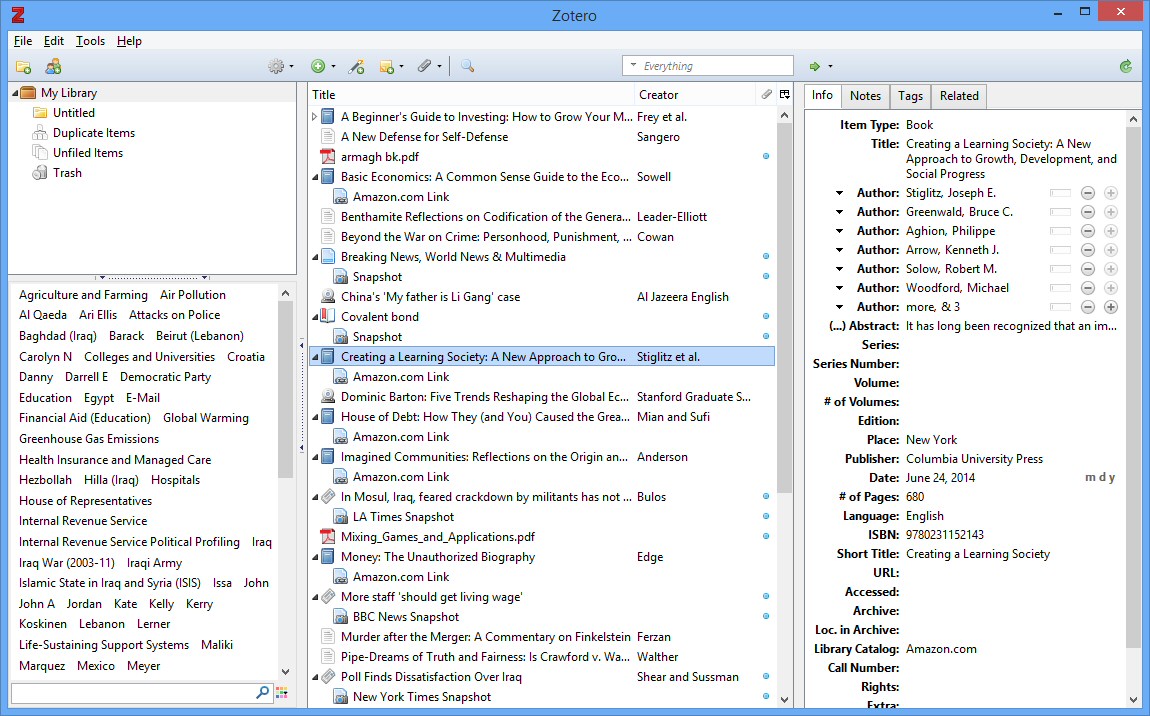
Zotero

Zotero
- Install Better BibTeX extension
- Create collection for project
- Add references to collection
- Export Collection (check Keep Updated) to BibTeX
Set bibliography
- In YAML header, assign
bibliographyto the project’s.bibfile
Insert citations manually
- Find BibTex key in Zotero (e.g., Stevens.etal.2023)
- Insert with
[@citation.key]:[@Stevens.etal.2023]yields (Stevens et al., 2023) - Separate multiple citations with
;:[@Stevens.etal.2022; @Stevens.etal.2023]yields (Stevens et al., 2022, 2023) - Add prefixes and suffixes:
[see @Stevens.etal.2023, pp. 25]yields (see Stevens et al., 2023, pp. 25)
Insert citations manually
- Use parentheses only for date by removing brackets:
@Stevens.etal.2023yields Stevens et al. (2023) - Use only year by adding
-:[-@Stevens.etal.2023]yields (2023) - Add reference to bibliography without adding citation with
---
nocite: |
  @Barela.etal.2023
...
Insert with {citr} add-in
- Install {citr} with
remotes::install_github("crsh/citr") - Restart RStudio
- Start Zotero
- Start citr add-in, select Insert citations
Set citation style
- In YAML header, assign
cslto citation style.cslfile
- Get CSL files from Zotero Style Repository