Publications

Jeff Stevens

2023-05-05

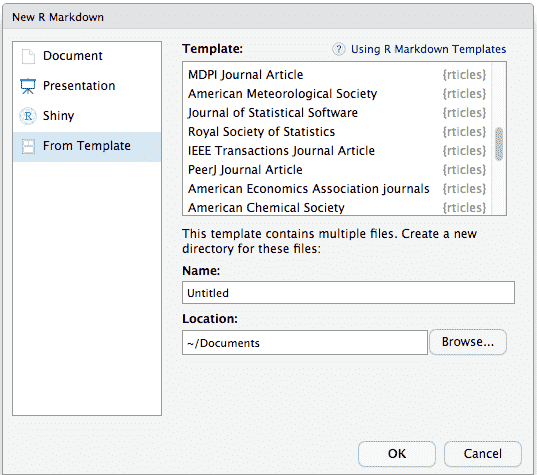
Journal article templates

Templates

{rticles}

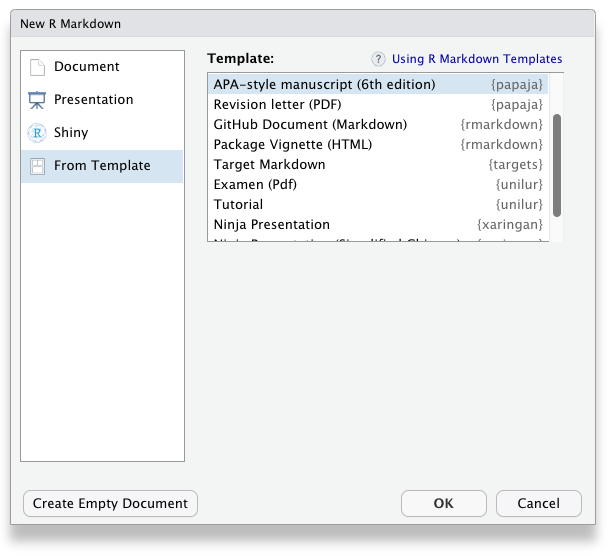
APA template

{papaja}

APA template

{papaja}

Quarto APA template

Extracting statistics

Extracting statistics

apa_print()

Run a t-test

library(palmerpenguins)
library(tidyverse)
(penguin_ttest <- t.test(formula = bill_length_mm ~ sex, data = penguins))

    Welch Two Sample t-test

data:  bill_length_mm by sex
t = -6.6725, df = 329.29, p-value = 1.066e-10
alternative hypothesis: true difference in means between group female and group male is not equal to 0
95 percent confidence interval:
 -4.865676 -2.649908
sample estimates:
mean in group female   mean in group male 
            42.09697             45.85476 

View structure of a t-test

str(penguin_ttest)
List of 10
 $ statistic  : Named num -6.67
  ..- attr(*, "names")= chr "t"
 $ parameter  : Named num 329
  ..- attr(*, "names")= chr "df"
 $ p.value    : num 1.07e-10
 $ conf.int   : num [1:2] -4.87 -2.65
  ..- attr(*, "conf.level")= num 0.95
 $ estimate   : Named num [1:2] 42.1 45.9
  ..- attr(*, "names")= chr [1:2] "mean in group female" "mean in group male"
 $ null.value : Named num 0
  ..- attr(*, "names")= chr "difference in means between group female and group male"
 $ stderr     : num 0.563
 $ alternative: chr "two.sided"
 $ method     : chr "Welch Two Sample t-test"
 $ data.name  : chr "bill_length_mm by sex"
 - attr(*, "class")= chr "htest"

Extract information from t-test

library(papaja)
apa_print(penguin_ttest)
$estimate
[1] "$\\Delta M = -3.76$, 95\\% CI $[-4.87, -2.65]$"

$statistic
[1] "$t(329.29) = -6.67$, $p < .001$"

$full_result
[1] "$\\Delta M = -3.76$, 95\\% CI $[-4.87, -2.65]$, $t(329.29) = -6.67$, $p < .001$"

$table
A data.frame with 5 labelled columns:

  estimate       conf.int statistic     df p.value
1    -3.76 [-4.87, -2.65]     -6.67 329.29  < .001

estimate : $\\Delta M$ 
conf.int : 95\\% CI 
statistic: $t$ 
df       : $\\mathit{df}$ 
p.value  : $p$ 
attr(,"class")
[1] "apa_results" "list"       

Extract information from t-test

apa_print(penguin_ttest)$full_result
[1] "$\\Delta M = -3.76$, 95\\% CI $[-4.87, -2.65]$, $t(329.29) = -6.67$, $p < .001$"

Insert statistics as inline code

Male and female penguins differ in their bill length (`r apa_print(penguin_ttest)$full_result`).

Male and female penguins differ in their bill length (\(\Delta M = -3.76\), 95% CI \([-4.87, -2.65]\), \(t(329.29) = -6.67\), \(p < .001\)).

apa_print() objects

  • Mixed models (lmer(), glmer())
  • Non-linear models (nlme())
  • Estimated marginal means (emm())
  • Within-subjects confidence intervals (wsci())
  • Bayes factors (from BayesFactor package)

Printing p-values

printp()

printp(0.23456)
[1] ".235"
printp(0.23456, add_equals = TRUE)
[1] "= .235"
printp(0.000000000000001)
[1] "< .001"

Printing other numbers

printnum()

printnum(0.5555555)
[1] "0.56"
printnum(0.5555555, digits = 4)
[1] "0.5556"
printnum(0.5555555, gt1 = FALSE)
[1] ".56"
printnum(0.00000000000001)
[1] "0.00"
printnum(0.00000000000001, zero = FALSE)
[1] "< 0.01"

Examples of extracting statistics

Before and after journal articles

Pre-registration templates

{prereg}

{preregr}

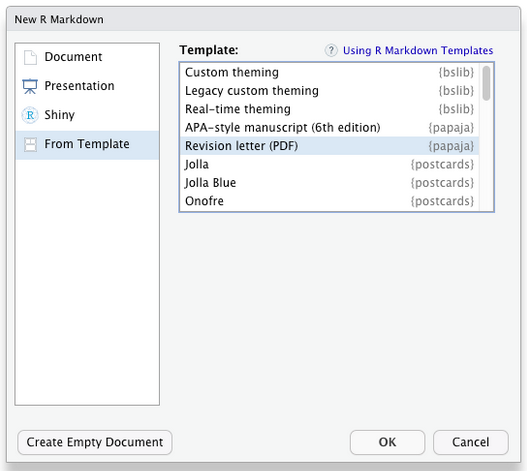
Revision letter template

Friends don’t let friends copy-paste

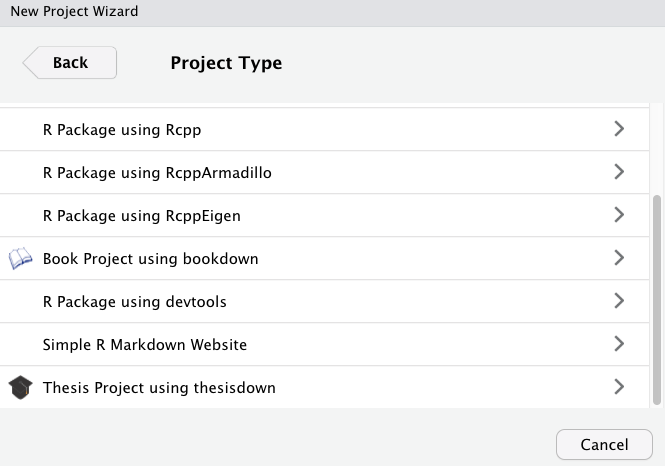
Dissertations

Dissertations in R Markdown

Let’s code!

Journal articles [Rmd]